Today in Statistics we started discussing linear regression. Before getting into the details of how it works, I wanted to help my students understand what we are trying to use it to achieve. That is, creating a linear equation that models bi-variate data.
To start with, I posted this data in Desmos on my smart board:
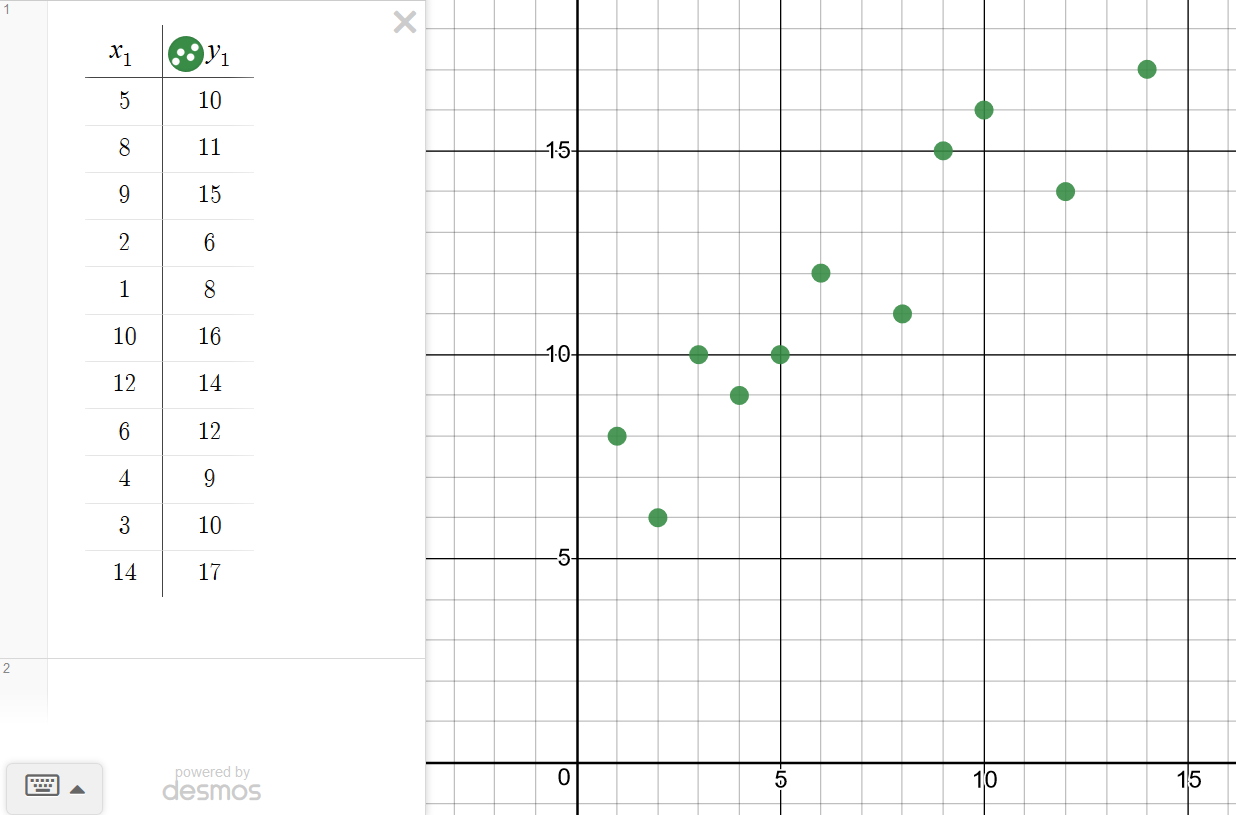
There’s nothing special about the data, they were just the numbers I happened to type into Desmos at the time. If I was going to do this again in the future, I think I’d want to source some real-world data to use. But as this activity didn’t have a whole lot of preparation go into it, there wasn’t a whole lot of opportunity to find that data. (That said, if you’d like to use my artificially created data, go for it.)
I had students create their own scatter plots for the data. Once they had done this, I told them to rule a line through the data that they thought summarized and modeled the data as well as possible. I informed them that there is an objective way to determine which equation does the best job of this, so it was now a competition.
Then the moment that revealed to us just how rusty some of their algebra skills are: I had them each find the equation of their line. After they complained that it’s been too long since Algebra 1 (despite most of them seeing this in Algebra 2 or Geometry with me last year), and a quick recap tutorial on slope-intercept form, they were able to find their equations.
Then to compare them, I typed their equations into Desmos so that we could visually compare them. I’m happy to say that most of the equations fit the data reasonably well, at least to the naked eye (which is, of course, all my students had to work with for the activity.) Then, I added one more line: the regression equation created by Desmos itself (in orange.)
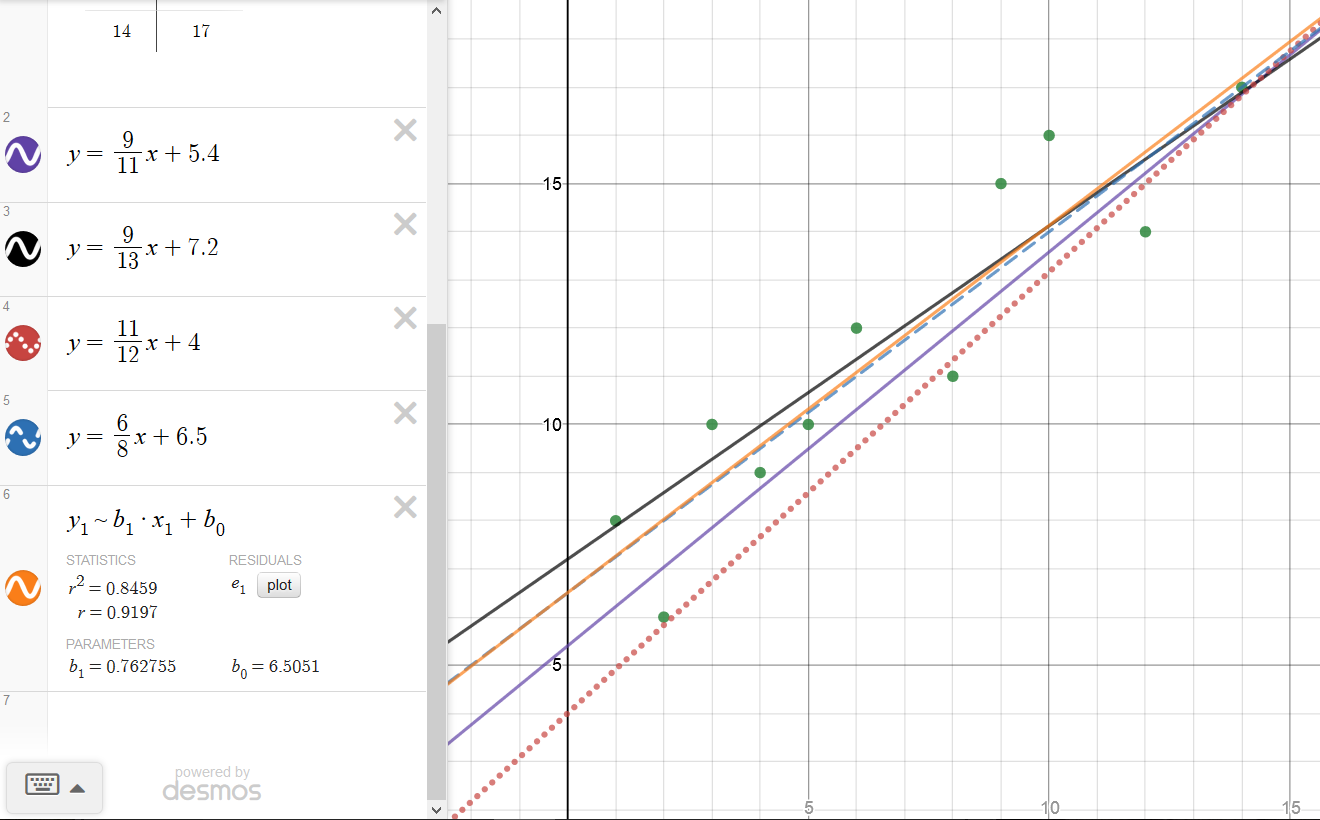
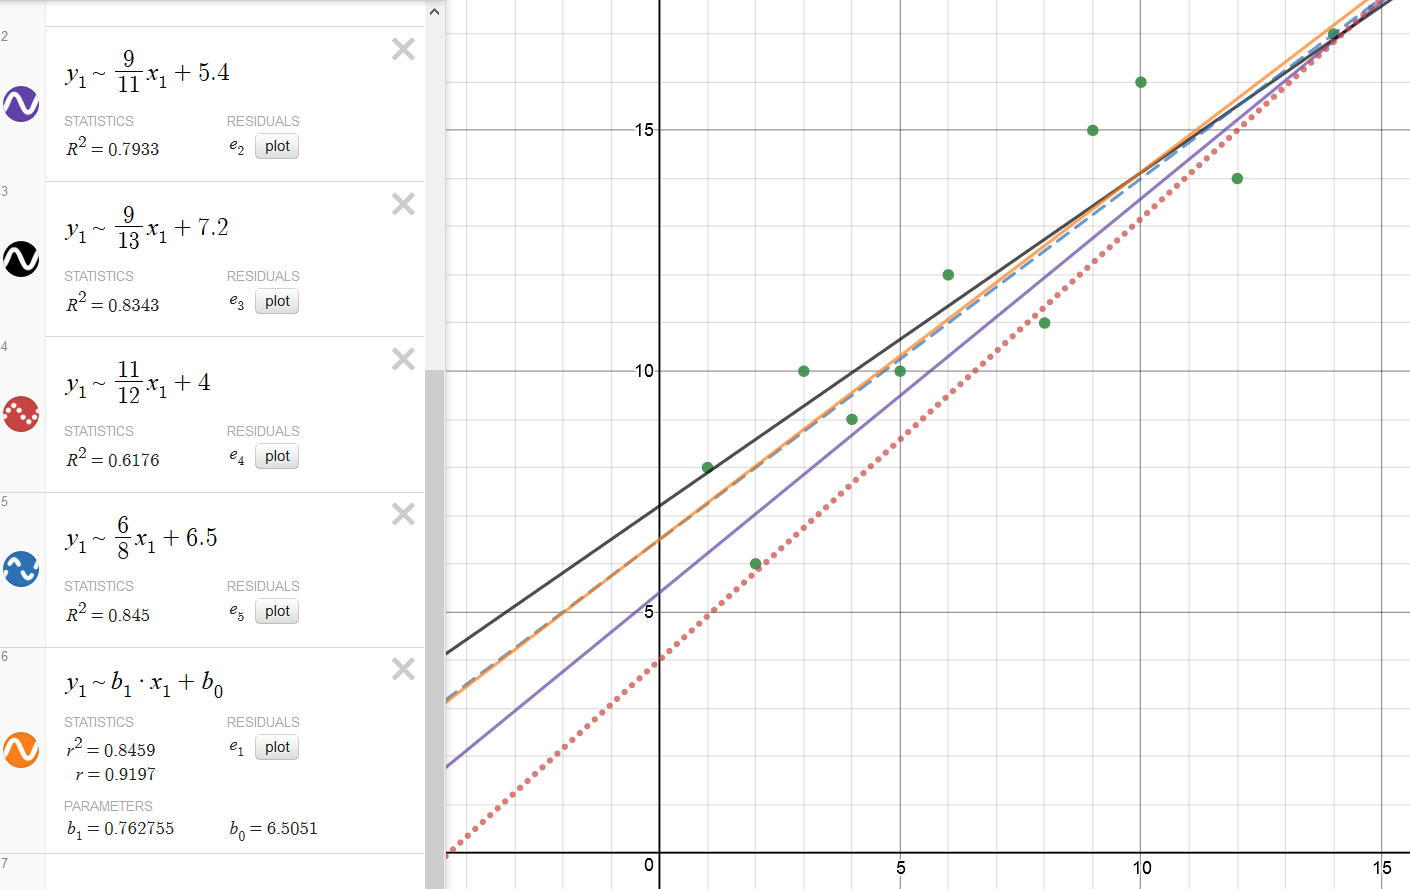
One of the lines (the blue dashed one) is actually very close! I also changed all of my students’ equations into regression equations, so we could compare their R2 values. For now, I just told them that this is a measure of how well the model fits the data. In future lessons, I will explain the more formal meaning to them.
To finish our discussion, I had Desmos plot the residuals for the linear regression equation, as well as for some of the students’ equations. I explained that what Desmos was doing was trying to make these residuals as close to zero as possible. Over the next few days, we’ll start to get into the details of how the mechanisms of regression actually work. But for this lesson, I wanted to give students a sense of what regression is about, rather than how it works.
I am so thankful for this post! I’m introducing linear regression to my Algebra 2 students tomorrow and didn’t know how to make Desmos calculate residuals from student-generated equations. Your help is going to make our lesson so much more meaningful! Thank you!
Glad to be of help!