Second last week of the year, and my Year Nines have a serious case of the I-don’t-cares. End-of-year activities next week and the fact their reports were written last week have given them the idea that they don’t really need to work this week.
Unfortunately for them, I see this as one last chance to do maths with them this year. So we’re doing maths. The good news is my love of Desmos is starting to rub off on them, so they were happier about working when I told them we were using it.
On Monday we looked at the y = a (x – h)2 + k form of quadratic functions, and how to produce its graph by transforming y = x2. I could have done this by telling them what each of the transformations were, then have them repeatedly sketch graphs. Instead, I wanted them to actually investigate how to produce the transformations themselves.
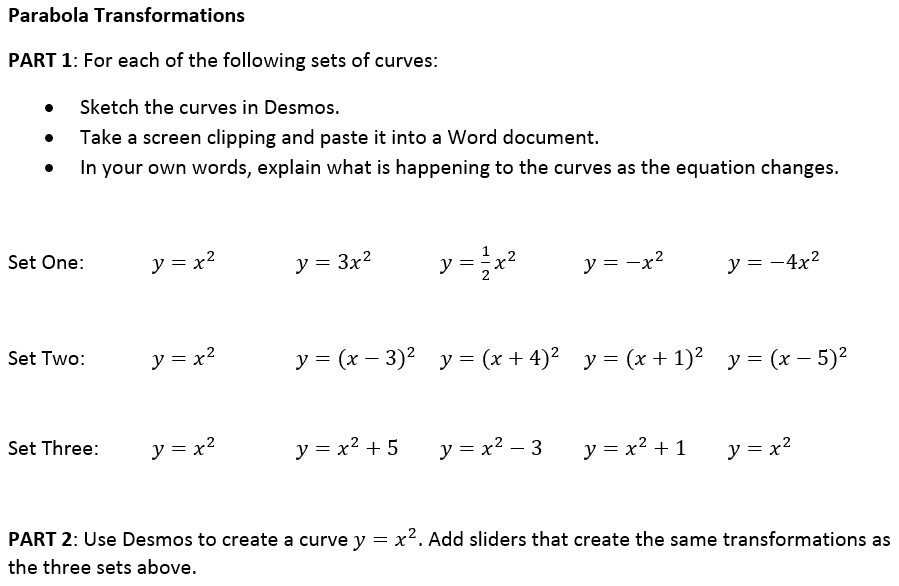
I gave the students the following sheet of instructions:
This was written in a bit of a rush, which explains the mistakes (well, that’s my excuse, anyway). In Set Three, I’ve included y = x2 twice. When the kids called me out on that, I suggested they make up their own function that they think fits the pattern in the rest of the set. Even though this wasn’t my original plan, I’m thinking now that having students add their own examples to each set might be a good idea.
And Part 2 was just badly written. I found I had to re-explain it numerous times over the lesson. I’m okay with my students being confused because they don’t know how to do something, if it leads to them thinking for themselves to figure a problem out. But it’s not okay that they were confused about what they were being asked to do. (Note to future Shaun: your question is broken, FIX IT before you use it again!) If it’s not clear, the intention was to create something like this:
Part 3 was shown on the IWB rather than on the handout:
Using what they created in Desmos, they needed to find the equation that matched the parabola described. This worked really well – it made students think about how changing the equation transformed the graph. At no point did I tell them that (h, k) is the turning point, or that the y-intercept could be changed by dilating the graph. They had to work this out for themselves. And when they thought they found the equation (and inevitably asked me if they were right), I could tell them to type it into Desmos themselves to make sure it worked as they expected.
The last one worked well, because the students found it much harder than the others – leading to a great discussion about why this form of the equation is not so useful in that situation. Given we just covered the null factor law last week, we were able to discuss how the factorised form was more useful.
Unfortunately, this is as far as we got. My kids can feel the end of the year coming, so they don’t think they need to work. In an ideal world where I didn’t have to stop students from online shopping and playing games instead of opening Desmos, I would’ve continued a bit further with the lesson:
- I wanted students who finished earlier to create their own questions for Part 3, and add them to the list for others to do (which is why this part was on the IWB).
- One nice thing from this lesson was that students were exploring dilations, reflections and translations without me telling them what they are. But that does mean they still don’t know those terms. I wanted to finish the lesson by taking a few notes to define the terminology.
It was more than a little frustrating to not be able to finish this off properly. But I think the work we did get done worked well.


