Homemade Algebra Tiles

I’ve been lacking in the algebra tile department lately. They aren’t the cheapest things to buy, so I decided to make my own.

My very own homemade algebra tiles

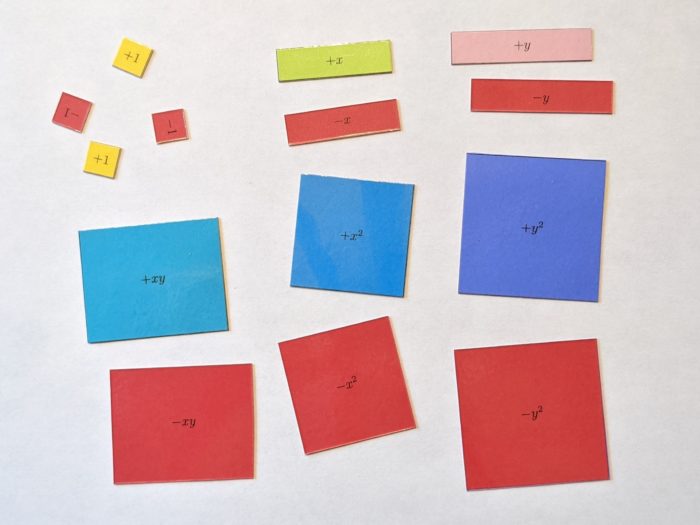
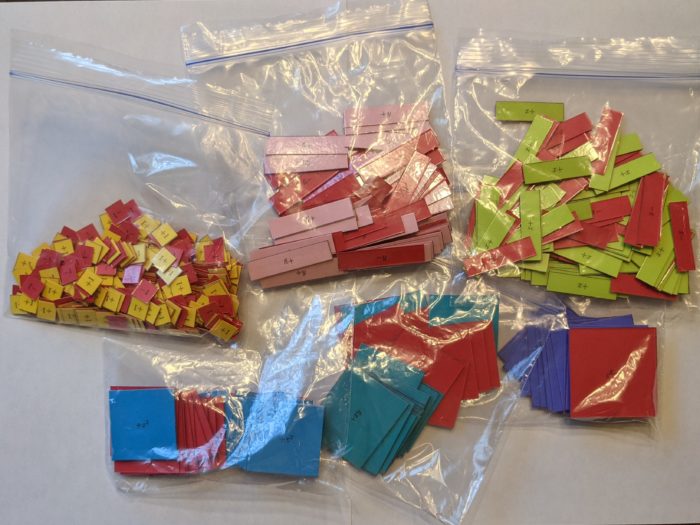
They actually turned out a lot better than I expected. As you can see, they’re double sided for negatives, and include the variables x and y. I’m not sure how long they’ll survive once they get into the hands of students; they’re laminated, but the two layers of paper are only held together by glue stick. For now, though, they seem pretty sturdy.

Lots of lovely tiles in bags

While there are probably other algebra tile templates online, I made my own, which you can download here:

Here’s how to put them together:

  1. You will need:
    • Printer.
    • Various colors of paper.
    • Red cardstock. Or just paper. I used cardstock because that’s what I had, but I think it helped make the tiles a lot sturdier.
    • Glue. I used a glue stick, but there may be better options. I want to try a spray adhesive next time.
    • Laminator and laminating sheets.
    • Scissors and/or other paper cutting device.
  2. Print the positive sides (odd numbered pages) on the colored paper. Make sure every page is printing using the same scale. (I just printed at “actual size” to make it easier.)
  3. Print the negative sides (even numbered pages) on the red cardstock.
  4. Cut around the dotted border on the -1 page. (Page 2).
  5. On the +1 page (page 1), use a pencil to mark where the outside corners are on the back of the paper. Hold the paper up to a light if it helps.
  6. This is the tricky bit: Glue the -1 page to the +1 page, back to back. Be very careful to glue the entire surface, or any gaps will become tiles that have nothing holding them together. Use the pencil marks to line the pages up.
  7. Repeat for all the other pages.
  8. Laminate each set of tiles.
  9. Carefully cut the tiles apart.

Was this the best use of my time a week before school goes back? Almost certainly not. But doing something crafty to prepare for school has helped get me more enthused about the upcoming year, and more motivated to get the important things done. Maybe a small project like this is what you need, too.

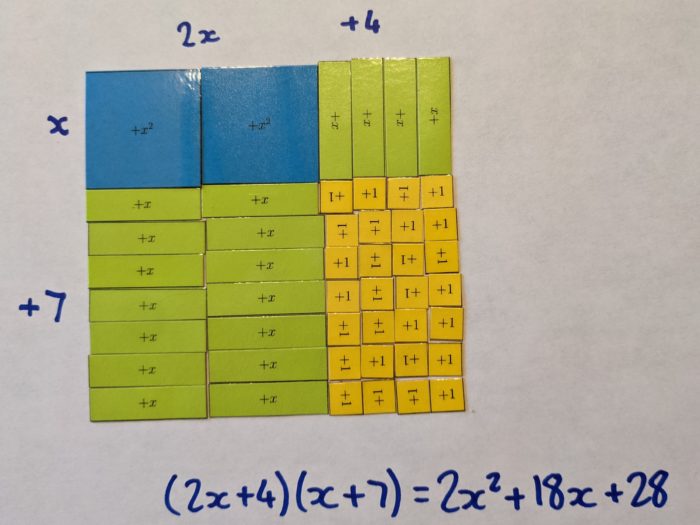
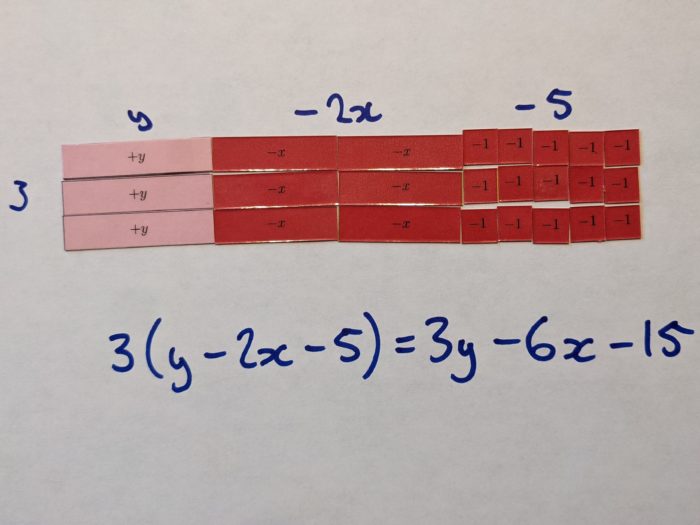
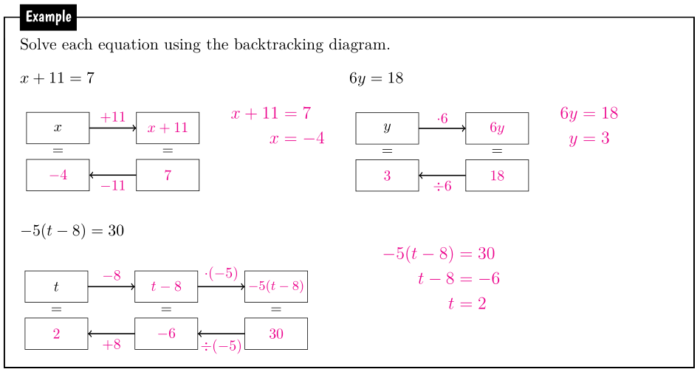
Actually, the main impetus for making these tiles is the presentation I’m giving at the #NEOKMath Teacher Conference in a couple of days (Thursday, August 5). I’m talking about methods to familiarize students with the distributive property, which includes using algebra tiles. If you’re reading this the day I post it, and you live in north east Oklahoma or nearby, it’s not to late to sign up to attend. And it’s free. I won’t even be offended if you skip my session to hear someone else.

Here’s a couple of examples I made for my presentation, using these tiles:


Pre-Algebra Notes version 0.1

I’ve been working on a comprehensive set of notes for Pre-Algebra for over a year now. While I wouldn’t call them perfect, I’ve finally got the notes into a state that I’m happy to share with the rest of the world.

I had an initial draft version of these notes last August, but they had many problem that I’ve had to work on. The biggest issue was that I hadn’t actually taught through a Pre-Algebra course before. Covid, changing so many things like it has, meant that I couldn’t use printed notes as I’d hoped at the start of the school year, but as the year progressed and our understanding of teaching in a pandemic developed, I was able to start incorporating printed notes at times. Following the end of the school year, I went through the entire course in detail, using my students’ experiences over the year to refine the notes and even expanded certain topics that need more time to develop. The result of that review is what I’m sharing here.

Pre-Algebra Notes Downloads (v. 0.1)

I plan to keep improving these notes, as well as produce other material to support them. I have a first draft of practice exercises for the first three units, though those still need much more work before I’m ready share. Eventually, I’d like to create a catalog of resources and activities, aligned to each section of the notes, that would give any Pre-Algebra teachers (including myself) a huge leg-up in developing their own curricula, but that dream is still a long way off.

A note of caution that I’ve written these notes with the Oklahoma Academic Standards in mind. (Standards alignment document coming soon, hopefully.) While I’d love for as many teachers as possible to use these notes, be aware that I haven’t referred to Common Core or whatever other standards you might be using at all, so there may be some topics you expect that are missing or incomplete. I’d love to fill in those gaps for other states and countries one day, but no promises.


Desmos Activity: Plotting Linear Functions

Here’s an activity to practice graphing linear functions that I’ve made using the Desmos Activity Builder. It’s suitable for distance learning, because that’s how I used it this week.

It is Linear Function Practice: Rule to Table to Graph, and its name pretty well describes what it’s about. Students are presented with a rule for a linear function. Using that function, they construct an input-output table. Then, students plot the graph of the function using the points in the table.

The activity is self-checking. As the table is filled in, check marks indicate whether each row correctly satisfies the rule. Then, after students plot their graph, they can have the correct answer shown underneath their work. They can then go back and fix their graph if they’ve made an error. Of course, students could abuse this and look at the solution before drawing their own, so I added a couple of features discourage this. The solution button only works if the graph has a line drawn on it. And the activity reports to the student how many times they’ve clicked the solution button, hopefully provoking the pride of a few students to only attempt to check the solution once.

The black dashed line is the correct line. This means the green answer is also correct!

I should note that the activity makes no mention of (and doesn’t assume knowledge of) slope and intercepts. At this point, I’m just trying to make sure my students clearly understand the connections between the different representations of a function. At its most basic, a plot simply represents the ordered pairs that make a function as points on a coordinate plane – slope and intercepts are just characteristics of that plot that we observe. My classes have not reached the point of making those observations, yet.

Each screen is a separate question. In fact, each screen (except the last, where students choose their own function) is essentially the same. The only changes are the function and the input values that prepopulate the table. This is basically because I’m lazy and wanted to copy and paste each screen means that it shouldn’t been too hard to edit the activity. If you want to add or remove functions, or change them, or change the entries in the table, feel free to do so! In fact, one intention is that others be able to copy a screen into their own activities with a minimal amount of effort.

If you’re looking to customize a screen, you’ll find there’s a math input box which doesn’t actually appear to students. Look in the CL here, and you’ll find the definition of the function for the screen – the rest of the CL on the screen points back to this.

I found this worked really well with my students. It was a lot better than my original plan would have been, which was to have students practice on graph paper and send photos of their work to me. Having the activity be self-checking is essential when students are working remotely and asynchronously, as mine were this week. Students knew immediately if they were doing something wrong, and if they couldn’t figure it out on their own, knew to come video chat with me. Of course, the dashboard in Desmos is invaluable for observing how students are faring with the work from afar.

The biggest problem I ran into was students thinking they didn’t have the correct graph because of my silly mistake. I made the solution line red. While most students drew their graph in blue (Desmos’s default sketch color), some changed theirs to red or purple, making the solution practically invisible if they had the correct graph. I’ve fixed that issue now, so your students should have a much more visible black dashed line for the correct line.

This week we also did an activity of the reverse process: taking a plot, creating a table, and determining its rule. Hopefully I’ll get that polished up enough to share as well in the near future.


Desmos Activity: Sieve of Eratosthenes

Here’s a digital activity I made for exploring integers and discovering prime numbers.

One of my favorite ideas to use in class is the Sieve of Eratosthenes. Even if you’re not familiar with the name, there’s a chance you’ve come across it before. It’s the algorithm to find the prime numbers which are left after the multiples of earlier prime numbers have been eliminated. (Given the name of this blog, there’s not much surprise I like this topic.)

Prime numbers are not required in the Oklahoma standards for the classes I’m teaching, but I thought the Sieve would make a good start of the year activity. I’ve shared an activity and worksheet based on this, but that was from a more naïve time, when sharing papers and colored highlighters seemed like a good idea.

So I went looking for a digital alternative, and after trying a few different approaches… well, you’ve seen the title of this post. The solution, as it so often is, was Desmos.

This is what I came up with:

https://teacher.desmos.com/activitybuilder/custom/5f3eb1f440d78831973bcd4e

Weirdly enough, this is the first activity I’ve created using the Activity Builder and the Computation Layer in Desmos. But over the last few years, I’ve either been in grad school, or teaching where I didn’t have one-to-one devices.

The activity is very similar to the worksheet I shared above. It steps students through identifying prime numbers, crossing out the composite numbers as they go. But instead of literally crossing out the numbers, students type the list of numbers and Desmos takes care of the crossing. Here’s a partially complete step:

There are some limitations here. I’ve only gone to 100, rather than 150 as I did in the original worksheet, because it’s a lot easier to use a square grid in this case. I preferred 150 originally, because it means crossing out the multiples of 11 makes a difference. (I did consider using something other than 10 by 10, but the grid is already getting a little cramped at this point.) Also, typing in the lists of the multiples gets tedious. Though, I guess that’s no more so than crossing the numbers out by hand. If anyone from Desmos is reading this: would it be possible to allow tables in the Activity Builder to automatically follow a pattern, as they do in the calculator?

This is the final result:

(Note that this image is taken from this graph rather than the activity itself, but I did use the graph to make the activity.)

If you’re looking for a way to discover prime numbers in class which doesn’t involve a paper grid, hopefully you’ll consider giving this a look.


Algebra 2 Class Notes v 0.3

Here’s the next version of my notes. If you’ve missed this so far, I’m writing a complete set of fill-in-the-blank notes for Algebra 2, specifically with the Oklahoma Academic Standards in mind. See my post sharing the first draft of the notes for my reasons for doing this.

There’s a lot of small fixes here, with things that could be written clearer, some additional examples, and, sadly, a lot of typos and other mistakes. The most substantial edits were to section 8.4, on natural exponents and logarithms. I’ve always been dissatisfied with the way the value of the constant e is justified in classes which precede calculus. I’m hoping that this explanation will satisfy students by alluding to the calculus, without teaching it explicitly.

Downloads are available here: