Building equations

Year 7 are currently working on solving equations with pronumerals for the first time. Specifically, we’re using backtracking to solve multi-step linear equations.

This year, I realised there’s a problem with getting students to understand backtracking. Before I can expect students to work backwards through steps to solve an equation, I need to make sure they understand how the equation goes forwards. I think that in the past I’ve been too quick in jumping into backtracking, without spending time on fortracking (I know that’s not a word, but I’m running with it).

I’m at an advantage over my students when they see an equation I’ve written. I’ve seen the entire process. I started with a variable and its value, then I applied a number of steps to build it into an equation. Then I know that the solution can be found by working backwards through those steps.

But students only see the last part of that process. And while a few students can look at that equation and see the steps hidden in it, many have no idea where the equation comes from or what it represents. My solution: pull back the curtain, and let students see the entire process themselves.

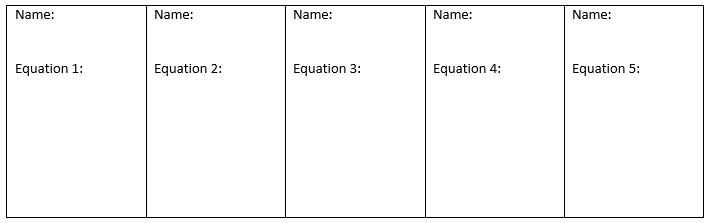
I created this worksheet for “building equations”:

After I gave and example, each student create five equations. Then, they wrote the final equation and their name in one of these boxes along the bottom of the page:

Then each student gave their equations to other students, who then glued them in their workbooks. The plan was for those students to solve these equations, but this had to be left to a later lesson, as the “building” part of the task took longer than I expected.

This was okay, as it allowed me do identify weaknesses a number of students had, particularly with the order of operations. One student ended up with 3(x + 1) in their equation, despite wanting to do the multiplication by 3 first. It seems they realise that parentheses have a role in deciding order, but are confused about how they work.

I started the activity by getting the class to talk me through an example, which students copied onto their sheets:

[An aside for me to remember later: Some of my kids seem to be amused by problems that involve using the same number repeatedly, hence all the threes. But in copying it here just now, I realised that (3j – 3)/3 is, of course, just j – 1. But also, (nx – n)/n is also x – 1 for any n. I wonder if there’s some activity I can create that involves exploring that fact?]

If you want a copy of this worksheet, you can find it here:


Solving Linear Inequalities

Semester 2 has started, which means the Computer Science elective I was teaching has ended. The good news is, I’ve taken over Year 10 Maths, which means my teaching load is more maths than it’s ever been before. I haven’t taught Year 10 for a couple of years now, and I’ve changed the way I teach a lot even in the last 12 months. Luckily, I had this same class last year so they’re pretty used to how I do things.

The first unit I’m teaching is Linear Relationships:

LR skill list

Most recently we’ve been working on LR2, linear inequalities. If these are taught as a totally procedural matter, it’s a fairly easy topic: solve them the same way as equations, just being careful with the direction of <, >, ≤ or ≥ if dealing with negatives. But as I always tell my students, I believe our aim is not to ‘get the right answer’, but to understand.

In particular, I want my students to understand that there is not just a single solution, but a whole set of solutions. I want them to understand that when we write a statement such as x ≥ -2, we are describing a rule by which some values are included and some are not. So I started the lesson by looking at a couple of examples:

A little is lost when seeing this as a static IWB page, as opposed to the notes that developed through class discussion. Importantly, all the possible solutions were provided by students. I was really pleased with their suggestions, in that they illustrated some important points about inequalities. For example, 4.999999999 is indeed less than five, as are all negative numbers. And I liked the suggestion of 6000893, pointing out that there isn’t an upper limit for x ≥ -2. And I impressed the student by hearing and remembering the number he called out :).

Next I gave an example of an inequality to solve. Rather than getting the class to solve it as an equation, I had them each make a list of five values that would be included in the solution, and five that are not. We then shared some of these as a class:

What this allowed us to do was find the solution to the equation by understanding what the equation described. It’s important as a maths teacher to ensure students know why they do things they do. When students solve equations, they shouldn’t following a list a pre-described steps to get ‘the answer’. They should be trying to answer the question, “What value makes this statement true?”

We also looked at 23 – 2x ≥ 15, and found that our solution doesn’t necessarily have the same direction as the inequality. My students quickly identified the negative in front of the x as the culprit. As one student pointed out, you need to make x smaller if you want 23 – 2x to get larger.

So, the class found two important pieces of information are needed to find the solution to an inequality:

  1. What is the boundary between the solutions that are included and the solutions that are not?
  2. Which direction do those solutions go in?

And how do we find this information? Using algebra, of course!

It’s at this point that I believe procedure becomes useful: after that understanding has been built. I’m increasingly finding that a good way to get students to follow a process I give them is to use a less efficient method they understand to do the same thing first. Students could solve inequalities by finding test cases each time, but they find solving them algebraically is a much quicker process. They look for shortcuts to make their work easier. Just like mathematicians do.


Petals Around the Rose

Firstly, credit where it is due: I was given this idea by Sarah Hagan, who found it on Annie Forest’s blog. So, thanks!

So, Petals Around the Rose (the name is really important!) is a game/puzzle which, if you followed that link just now, is likely making you really frustrated (sorry about that). Five dice are rolled, and you have to predict what score those dice make (and I promise that there is logic to how the computer decides the scores). If you use the site I linked to, you enter your prediction before seeing what the actual score was.

For the last couple of days, I’ve been using the puzzle in the last 5 minutes of my lessons with Year 7. One student has already seen the puzzle before (and is taking great pleasure in keeping the solution a secret), but as of yet, none of the others have figured it out.

They are trying, though. My students are very determined to find out what the answer is, and keep suggesting their own theories, unprompted. Because of how the game works, it’s easy to get them to test their theories – roll the dice again, and get them to give the score. Even if they manage to be right that time, it doesn’t take long to find a roll where their theory fails. But this is what mathematics is, right? Noticing patterns, coming up with conjectures, testing those conjectures, and going back to the drawing board if it doesn’t hold up.

This is their score as it stands now:

petals

I’m not sure how we’ll proceed with this now. I might wait until next week to bring this out again, but I do want to keep playing the game with the class until they figure it out. We’ll see how long that takes.

The question I’ve been leading to is this: How do I get students to display this same determination and persistence to finding actual mathematical patterns and theorems? I guess this is what every maths teacher spends their entire career trying to answer.


Unit Circle Poster (plus bonus poster!)

Not much to say here. I made a poster featuring the unit circle.

Here’s a picture:

Here’s some download links:

Come to think of it, I made a poster about Exponents and Logarithms a while back which I never shared. So, here’s that:

The font on both of these is “ChunkFive Roman”. I tend to go through phases with fonts I love. This seems to be my current obsession.

🙂


Pythagoras Problem Solving Redux

Year 9 and I are working through Pythagoras’ Theorem at the moment. After a little shuffling of units around, this is a little earlier than last year. An interesting consequence of this is that this is the first unit I’ve taught that I’ve blogged about previously.

Getting to go back and see what I did last year has made planning this year’s unit so much easier (which is why I really need to make more of an effort to blog this year). Today I took one of my previous lessons and improved it in the best way possible: by adding Desmos!

(One of my students stated that I’m a little too obsessed with Desmos. I can’t really deny that.)

The task was Problem Solving using Pythagoras. Students were given triangle problems for which they weren’t given all the information to answer the question. I had them go through a process of drawing a diagram, defining variables, choosing values for those variables as an example, and finally defining a general solution using a formula.

My students struggled with the last part a little last year. They seemed to be able to go through the mechanical steps of rearranging formulas, but couldn’t necessarily understand the connection between the formula and the problem, or the reason for finding the formula.

This year, we used Desmos to support finding the formula. For all of Desmos’s graphing awesomeness, it’s easy to forget it works really well as a calculator too. After students solved the problem using their own chosen values, I had them use Desmos to verify their formula agreed produced the same answer:

Firstly, this let students check their working. But also, it let students see the value of defining the formula: by changing the values of the independent variables, they could find their new solution, without going through the process of solving the entire problem all over again.

That image also shows the way I often use Desmos and the IWB together. If the graphing area is not being used, it can serve as empty space for me to draw all over.