Planner Calendar 2017-18

Last year I created quite and elaborate set of calendar pages for my Arc planner. I was really pleased with how they turned out and thought they looked really nice.

And then I didn’t really use them. There was much more space than I ever really needed, and having multiple levels of pages (monthly and weekly views) meant I never really knew where to put anything. I really want to be the type of teacher to make constant use of my planner. I’m hoping that I’ve found a layout that actually suits the way I approach my planning.

I like having a broad view of a lot of days, but a monthly page doesn’t really help. Because the cycles of school don’t really occur in months, they occur in weeks. But one week to a page doesn’t show enough in my personal opinion. So I created a design that shows three weeks to a page.

I usually create this sort of thing in Publisher or Word, but this one is Excel, using formulas to set all the dates.

Download: calendar2017.xlsx

All the values reference the date in cell A2. If you want to change the starting point of the calendar, change that value (type the full date, not just the day). If you want, say, two weeks to a page, make the columns wider. The font is Wellfleet, but feel free to change that if you want.


Algebra Graph Sketcher (aka Parabolator 2)

A couple of months ago I shared a tool I created for sketching graph of parabolas. I called it the Parabolator. I don’t know why. It made sense at the time.

Anyway, I wasn’t satisfied with it. It has a lot of limitations – mainly, it can only sketch parabolas. Also, the code behind it is a mess. I thought I could do a better job, and thought it’d be much more useful if it could handle other types of functions.

I spent a few days working on a replacement. Then we went to Australia for two months, and I forgot about it. Then I remembered it today.

So, here it is! Introducing the Algebra Graph Sketcher. I know it’s a much more boring name than Parabolator, but I guess my desire to be accurate won out over my desire to be silly this time.

For anyone who’s interested, I’m using Vue.js for the control interface, D3.js for the actual graph, and Lodash for… something? I guess this is why you should post about something while you still remember how you made it in the first place.


Parabolator: A quadratic sketching tool

There’s a new version now, with more functions! https://www.primefactorisation.com/blog/2017/08/06/algebra-graph-sketcher/

Yesterday was the last day of our school year, so it’s finally time to relax! And by relax, I mean write code.

I was thinking about the tasks I want to set for next year, and wanted to find a tool to help create sketches of graphs. Not plots of graphs: there’s already an obvious solution for that. No, I mean a bare sketch that shows only the most important points. It doesn’t need to precise, but it does need to be clear, and easy to copy.

I searched for a while, but couldn’t find anything that was really what I wanted. There are plenty of tools that can do the job, but not without a bunch of messing around first. So I decided to write my own.

Introducing: the Parabolator.

To be honest, the code behind it is kind of a mess, and it’s extremely limited, but it works. Mess around with it yourself to see what it does. Basically, it draws a parabola based on the location of the vertex and one other point. The vertex and the “second point” can be dragged wherever to set the parabola’s position, while the “third point” will position itself on the existing parabola when dragged. The axes can be moved by dragging the whole sketch. Each of the points can be toggled invisible, have labels added, and can be “locked” to the axes. When you’re done, click the download button to save your graph as a SVG file.

To be clear, this is not intended to be a learning tool, and the target audience is not students. I made this purely to help myself create graphs for assignments, and I’m sticking it online because I figure other teachers might find a use for it as well.

The use case I see for this is the rapid creation of a graph that can put into an assignment or quiz paper. It saves as a vector image, so it won’t create big ugly pixels when printed as can happen when a graph is created from a screenshot. One thing I happily discovered today is that SVG files can be directly inserted into a Word document.

I’m not going to promise it works perfectly. I’ve really only tested it with Chrome, so use that if you want the best chance of it working properly. I did also have success in Firefox, but Microsoft Edge has problems with the download feature. The most obvious drawback to the whole thing is that it only does quadratics. I do want to modify it to support other types of functions, but I’ll leave that for another day.

This is just a hobby project, so I’m not sure if I’ll spend much more time on it. That said, I do have some ideas about what I want to do (especially with adding other functions.) If you’ve got any suggestions, I’d love to hear them.


Making my Gradebook more managable

We have one week to go, which means one thing. Okay, it really means a lot of things, but I’m thinking of one thing in particular. Certain students are just realizing what I’ve been trying to tell them all year. Their grade is not high enough and they’re going to have to retake a whole bunch of quizzes before the end of the year if they want to pass.

Let’s try and make this a bit more positive. There’s also a large contingent of students trying to turn Cs into Bs, Bs into As, and even some trying to turn 99% into 100%.

Whichever way you look at it, one result is that I have to spend a lot of time with my gradebook, entering quiz scores from random times throughout semester 2, and fielding requests from students to know their grade. The software my district uses doesn’t make this the easiest thing to do. It separates each “Nine Weeks” and makes switching between them annoying, taking a few seconds of loading time and completely resetting the view I had open just before. Throw in that the same thing happens if I want to enter attendance, and that adds up to a lot of wasted time. My solution to date has been to open multiple web browser tabs with a different view in each. But that makes my browser cluttered and remembering which tab is which among all my other tabs becomes difficult. Not to mention, the address bar and tabs take up valuable space for seeing students and their grades.

I’ve come up with a solution. Google Chrome has a feature that can turn any webpage into a standalone web application, which is displayed as a separate window with a title bar and nothing else. It appears as a separate app on the taskbar (in Windows at least), which means it doesn’t get mixed up with the rest of my random web browsing. The software my district uses is Wengage, but this applies equally to any gradebook you can access through Chrome (I haven’t tried this with other browsers, but they might do something similar.)

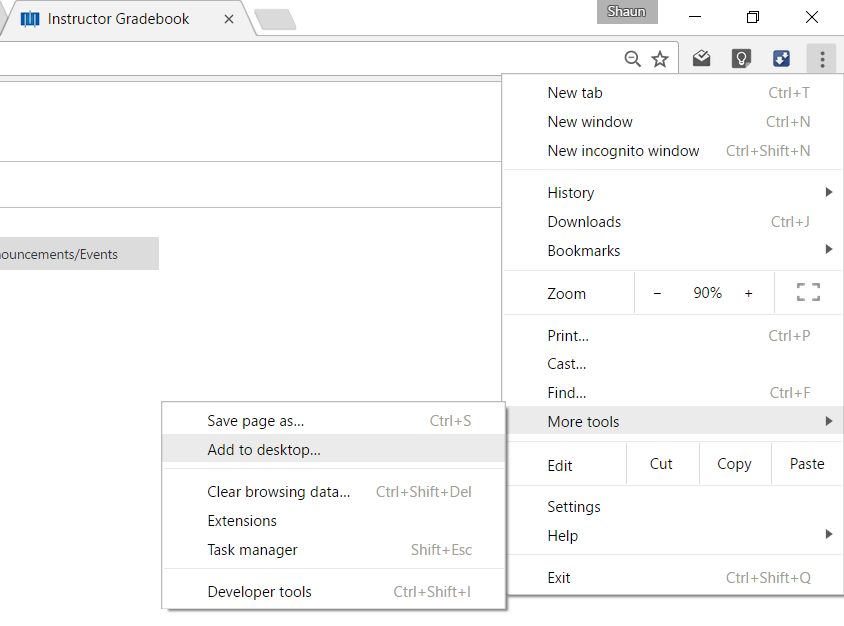
To do this, navigate to the page you want to make an app in Chrome. Click the “three dots” button (I’m sure Google give that a proper name) and select More tools, then Add to desktop…

This will put an icon for your new app on your desktop (unsurprisingly).

icon

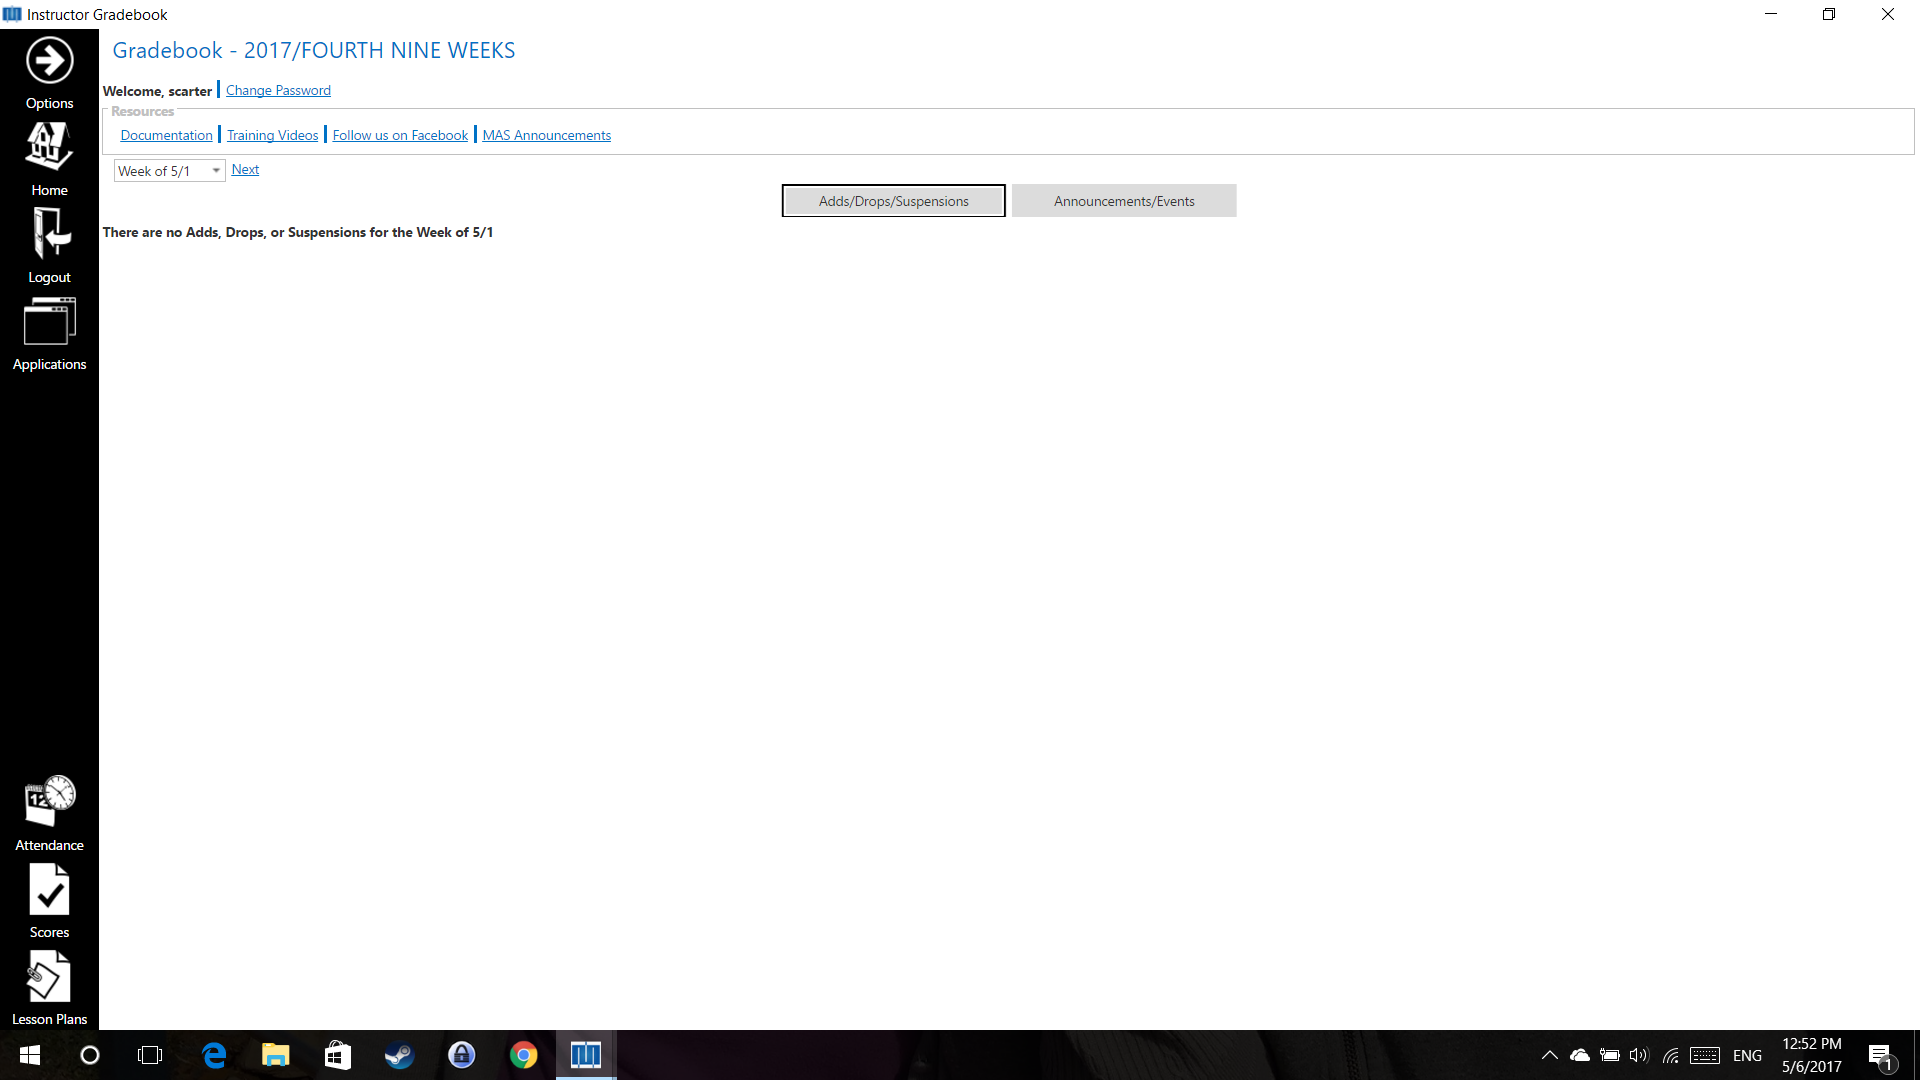
Double click that icon to open the app! If you want, you can find the option to “pin” the taskbar icon (keep it there even when the app is closed) by right clicking it.

app

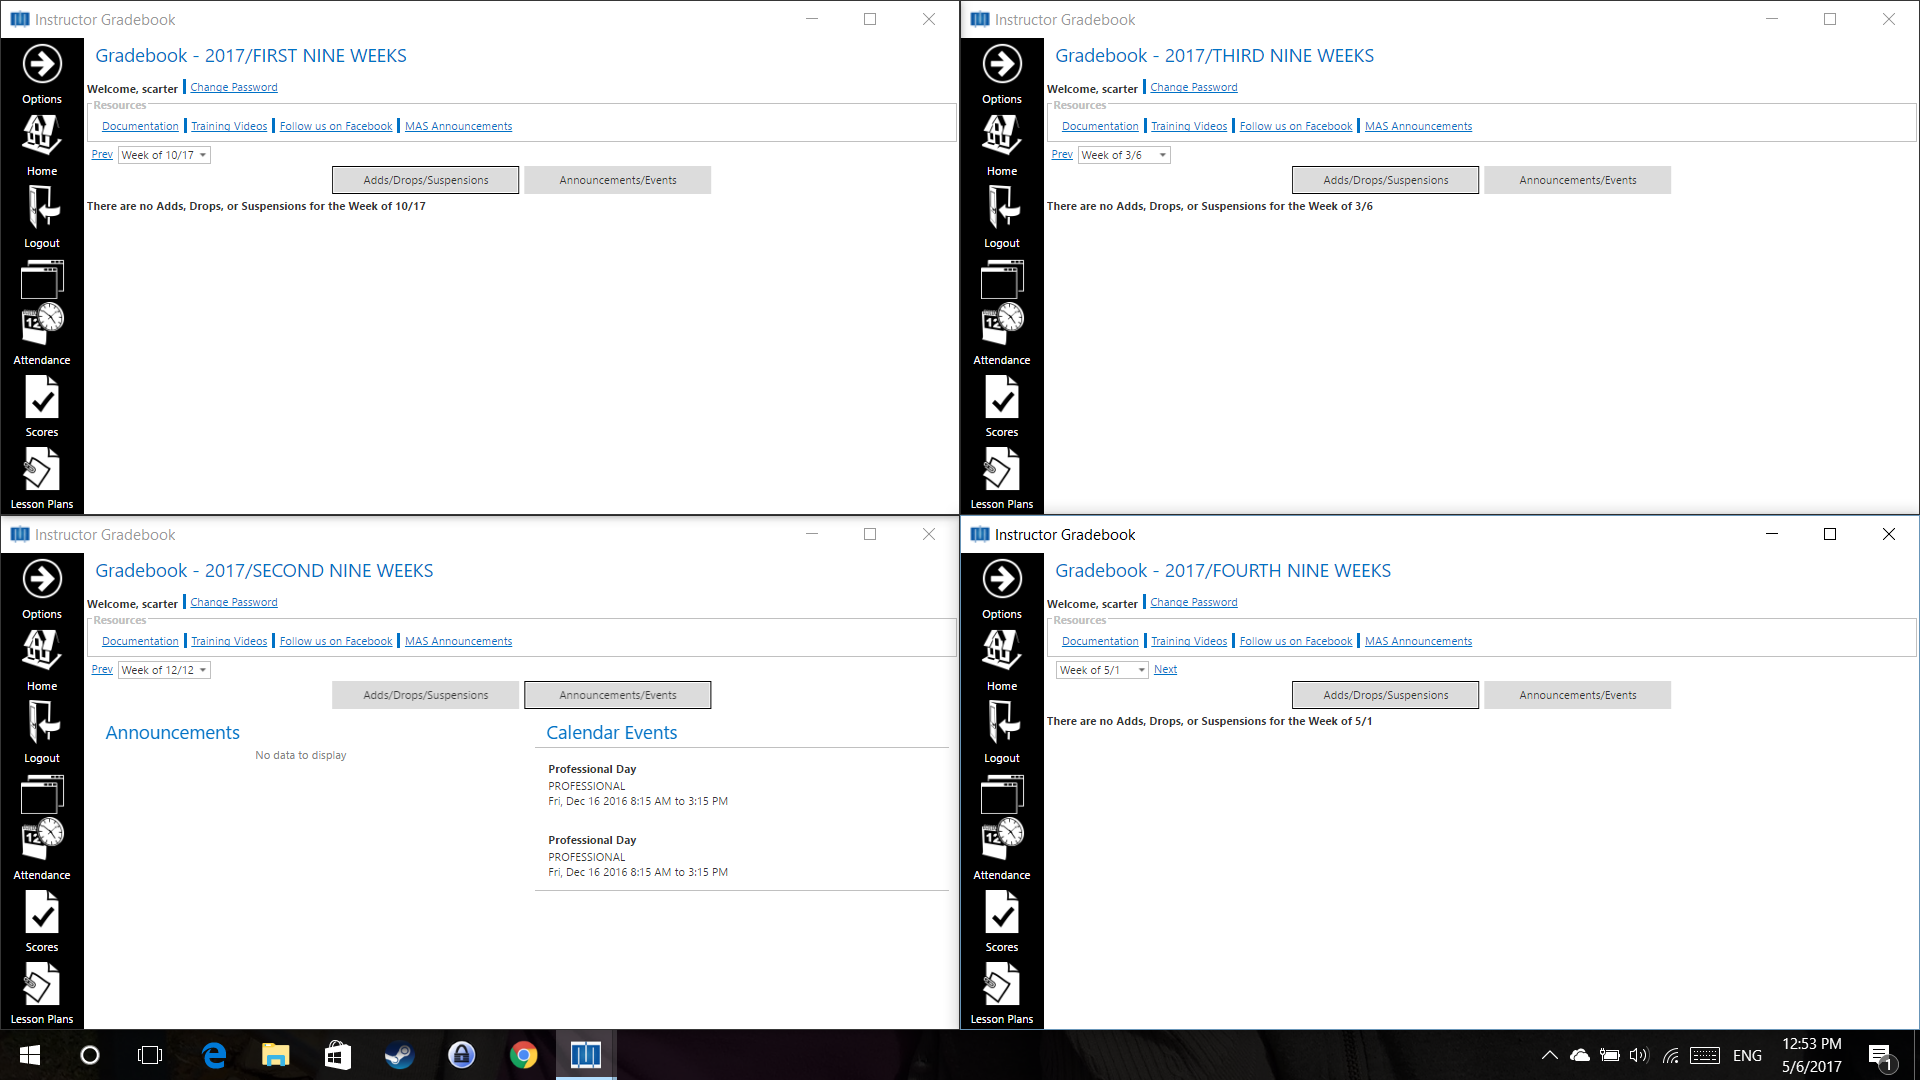
To be honest, it really is just a chrome tab that looks a bit different, but that’s exactly what I wanted. By appearing as a separate window, it’s out of the way but easily accessible. If you want multiple windows (say, one for grades and one for attendance) hold the shift key while you click the taskbar icon. (Useful tip: this works for almost all Windows programs.)

multiple

Is this going to revolutionize the way I manage grading? No, not even slightly. But it has made something I find annoying into something slightly less annoying. Which, to be honest, is exactly what I need as a teacher sometimes.


My first year. Again.

Two weeks to go.

Do you remember what it was like to be a first year teacher? I do. I remember it really well, because I feel like I’ve lived through it again. It turns out that starting a teaching career again in a new country is really hard. But just like my actual first year, I know that pushing through it has taught me so much about education and will make me a much better teacher as a result.

I could make this a “these are the differences between Australian and American schools” type post, but I’m trying to avoid that. Suffice it to say, there are some very big differences, which have meant I’ve had to make so very big changes.

My math classes this year have been Algebra 2 and Geometry. All math teachers in Oklahoma have had to learn new standards this year, but I’ve had to learn new subjects. I mean, it’s still math, but it’s not arranged in a way I’ve ever seen before. My year 7 maths and VCE maths methods plans are not going to do me much good anymore. Even when teaching the same content I’ve taught in other classes before, I can no longer make the same assumptions about what students have been exposed to in previous years.

So I’ve basically had to start from scratch. I mean, I could just follow the textbook each lesson. That would certainly make my life a lot easier. But that would go against everything I’ve come to believe about math teaching since beginning my career. I’ve got no problem using a textbook from time to time, and some books come with very interesting questions or investigation ideas, but the textbooks I have available are terrible. They’re old and falling apart, they’re much more focused on procedure than understanding, and they don’t even align to our standards now.

That means that on top of teaching subjects for the first time, I’m also doing interactive notebooks for the first time. That means creating a whole heap of resources throughout the year. I know there are many others who have shared their foldables online, but when it’s the night before I have to teach a lesson, I usually end up making something myself. So many times I’ve found stuff this year and thought, “This is great… but it doesn’t really fit with what I’ve done already.”

You may have noticed my lack of blogging this year. I’ve found it really hard to find the time when I need that time for lesson preparation, and when I’ve had the time I’ve felt I need to stop thinking about school for a bit. I really wish I could’ve had more time for reflection during the year, rather than having to deal with the constant onslaught of “what am I doing tomorrow?”

I really do feel like this has been a year of learning everything over again. I’ve been bringing a lot more work home with me than I have in a long time. I’ve taught a lot more lessons that I would describe as awful than I have in a long time. I’ve been challenged with a group of students that are not very willing to give my lessons a chance. I’ve questioned my ability as a teacher a lot this year.

But I don’t want you to think I’m in a negative mindset about teaching here. Because all of this also describes 2010, my first year teaching in Australia. And I know that year was the necessary challenge to get through to be the teacher I am now. And I’ll look back at this year too, and see how much I developed through it.

I’m already excited about what I’m doing next year. I’ve already completely revamped my list of skills for Algebra 2, and have even begun writing problem sets for topics I think I can teach much better the second time through. I’ve slowly been evolving my classroom structures over this year, after seeing which things work for me and which things work, and I’m keen to implement more cohesive routines from day one next year. I know I’ll get to reuse a lot of the stuff I’ve spent all that time on this year. And having a foundation to build on top of will give me the chance to craft much more engaging lessons with more student creativity and problem solving.

Just like my first-second year, my second-second year will start with me as a much stronger educator.