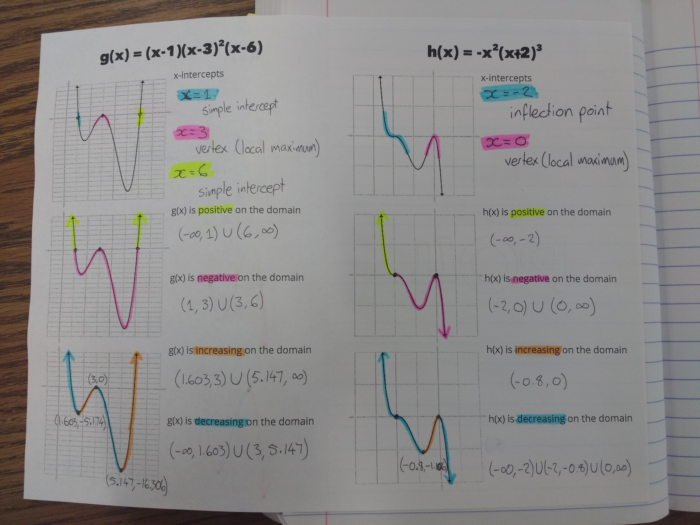
Here’s an INB page I created to introduce students to analyzing graphs of polynomials.
Each graph is repeated three times, so we can (literally) highlight different aspects of it. Luckily for me, Sarah is amazing at acquiring classroom supplies, so I have a lot of highlighters for students to use.
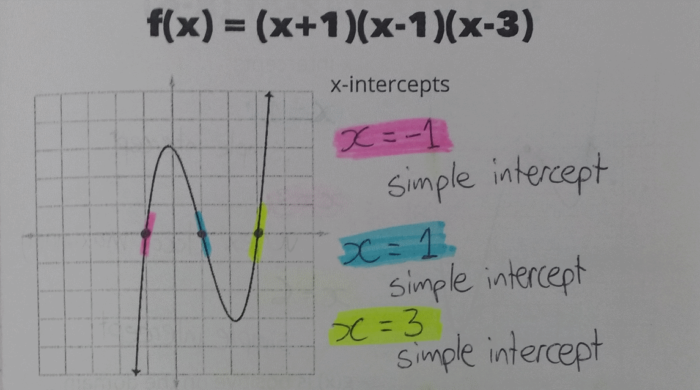
The first part was identifying the x-intercepts and the nature of each of the intercepts. I had students highlight the curve around each intercept, to emphasize whether they are simple intercepts, vertices (local minima or maxima) or inflection points.
As students did this, I tried to direct the conversation to figuring out why particular polynomials led to particular types of intercepts. This was actually really easy, as the class were asking and answering these questions without much prompting from me at all.
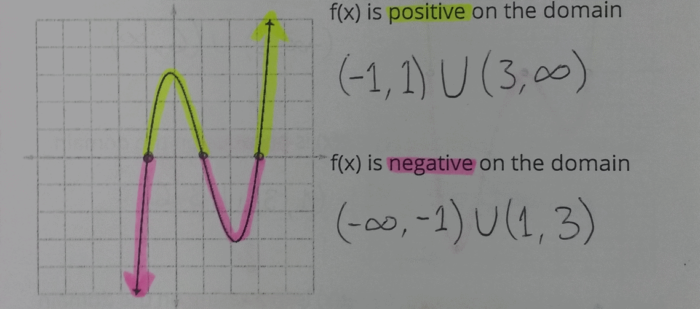
Next, we found the intervals for which each polynomial is positive, and for which they are negative. Having students visually represent the sections which are positive and negative really helped them in identifying those intervals.
I just (as in, while I’m writing this post) had an additional idea to help with this part. If I’d given each student a card, they could place the edge of it along the x-axis so that only the positive parts of the graph were showing. They’d highlight those parts of the curve, then flip it over so they could highlight the negative parts of the curve.
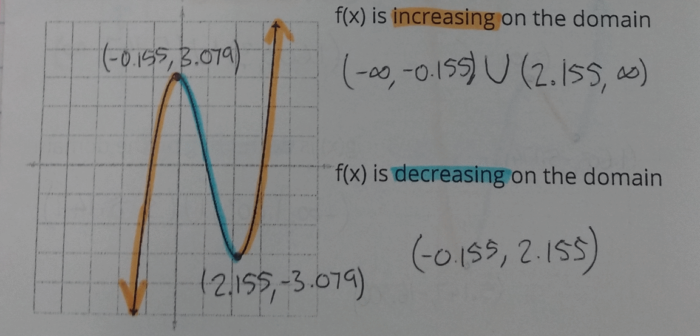
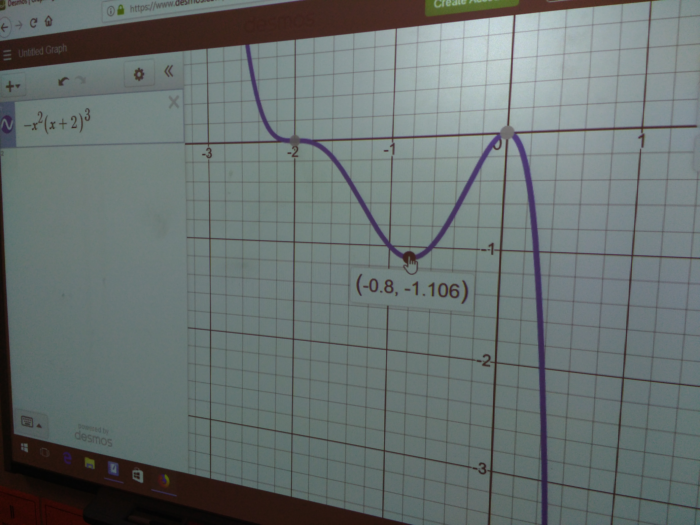
Finally, they highlighted the sections which were increasing, and the sections which were decreasing. To find each local maximum and minimum, I just had to quickly teach them some differential calculus…
… just kidding. We used Desmos.
Joking aside, I do like using topics like this to start hinting at the math that students may be seeing in the future. I was able to explain that a big part of calculus is looking at the rate and direction of functions, with a particular focus on where functions are neither increasing or decreasing.
If you’d like these notes, downloads are available here.
I used https://www.graphfree.com/ to make the graphs. I know I’ve made my own graph sketching tool before, but it’s really only capable of parent functions and simple transformations of them, so GraphFree was exactly the tool I needed this time. (To be honest, the main reason I’m mentioning GraphFree here is I’d forgotten what GraphFree is called when trying to find GraphFree the other day, so I want to remember that GraphFree is called GraphFree. GraphFree.)
Following this, we did further practice using section 6.4 of the practice book I’m working on. Follow that link if you’d like to get those practice questions yourself – for free!
