Over the last summer I completely rethought my Algebra 2 course. Part of this is my focus on parent functions through the first part of the year, giving students a solid understanding of each function and their transformations.
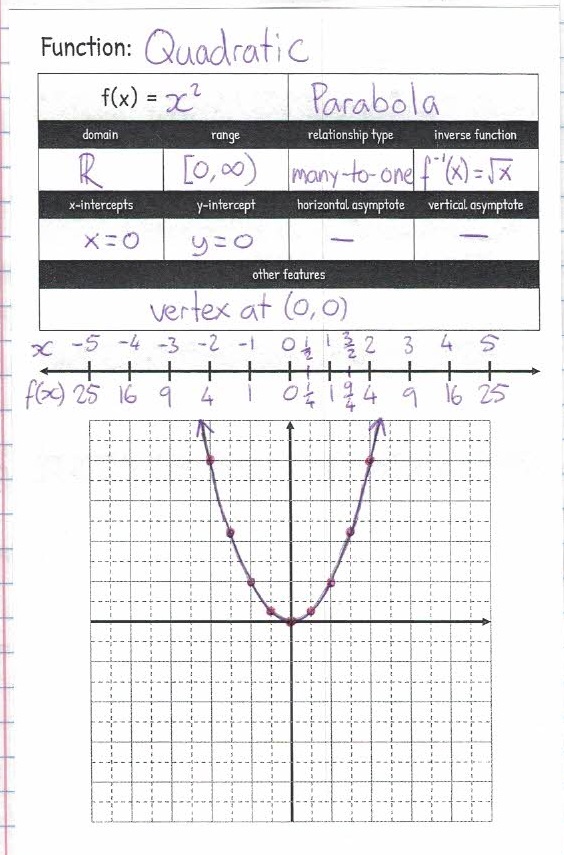
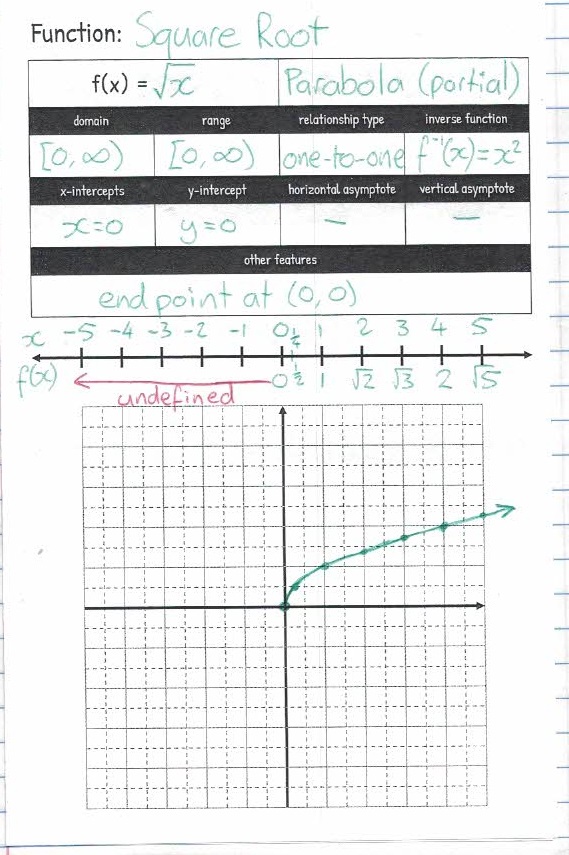
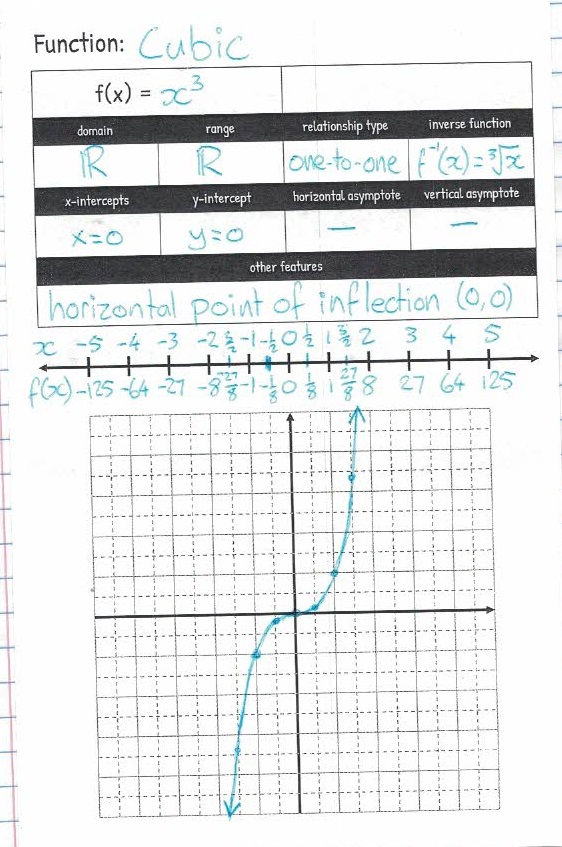
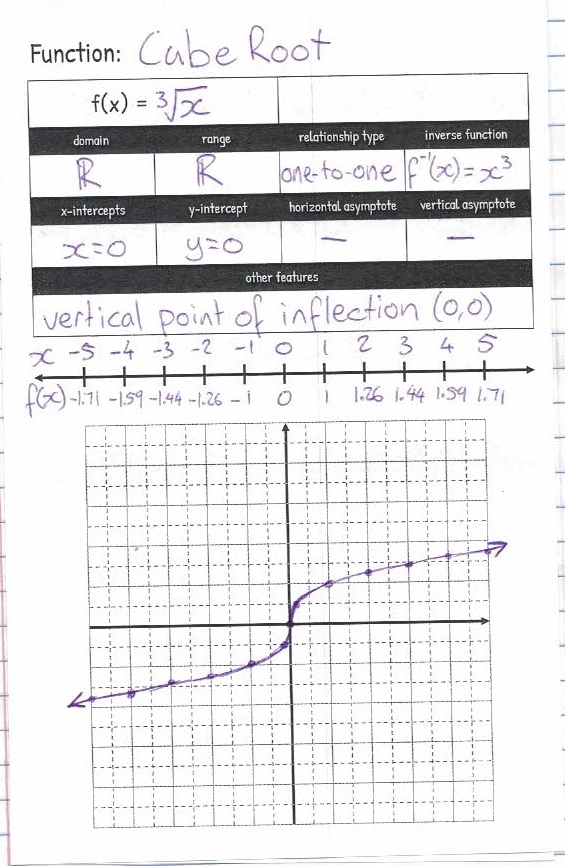
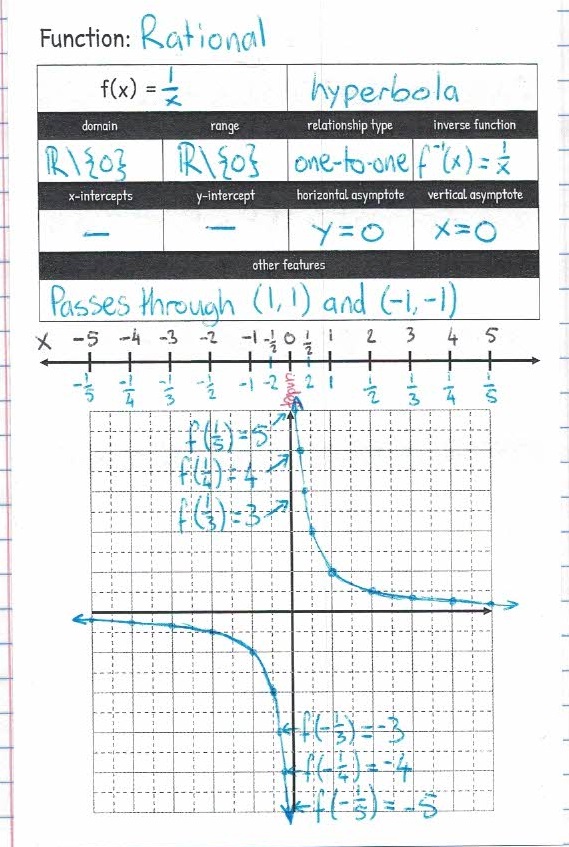
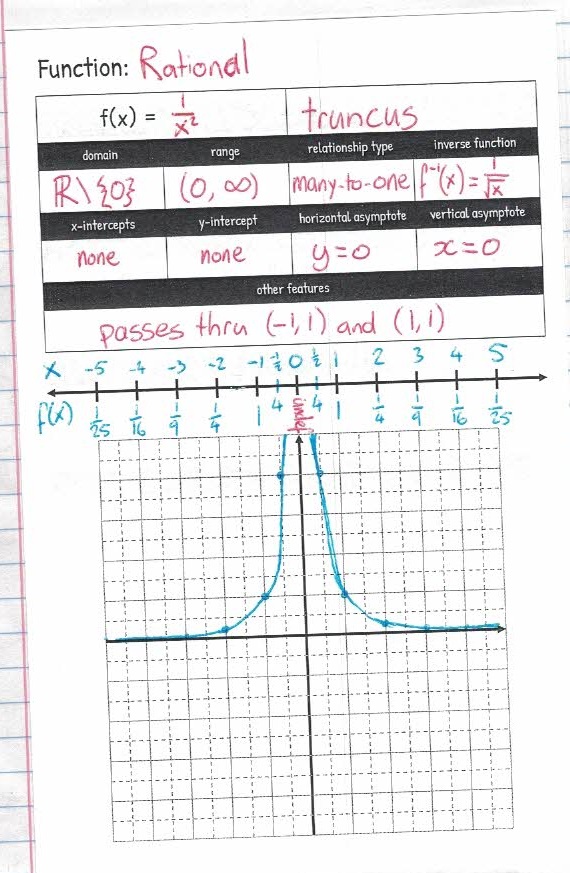
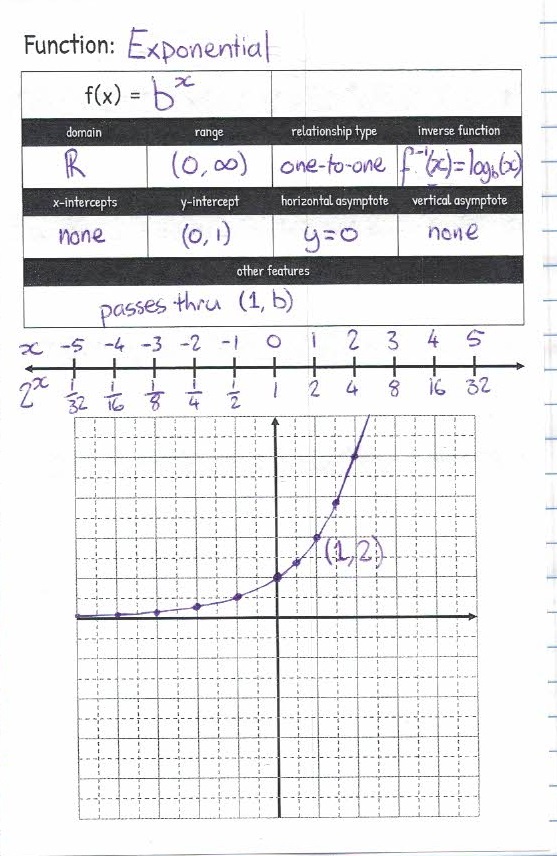
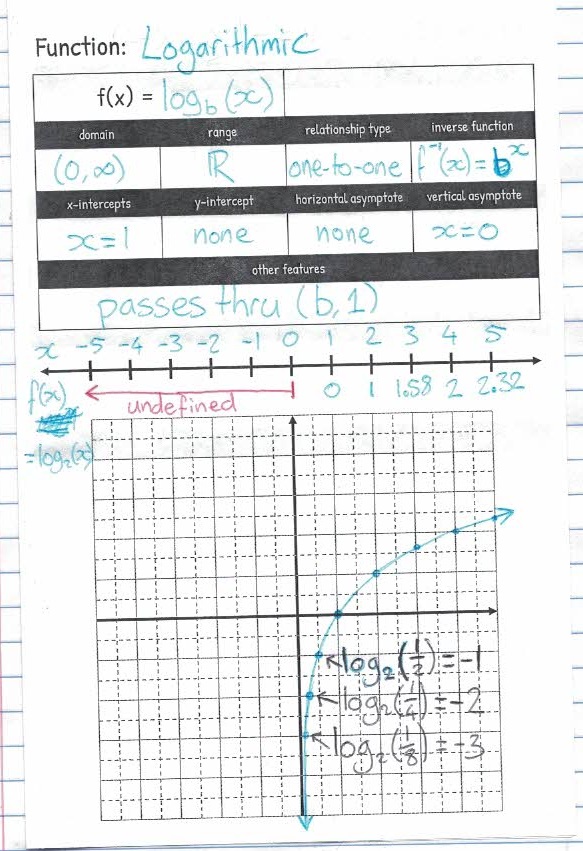
To help focus on the fundamental properties of each function, we used the following template each time we introduced a new function.
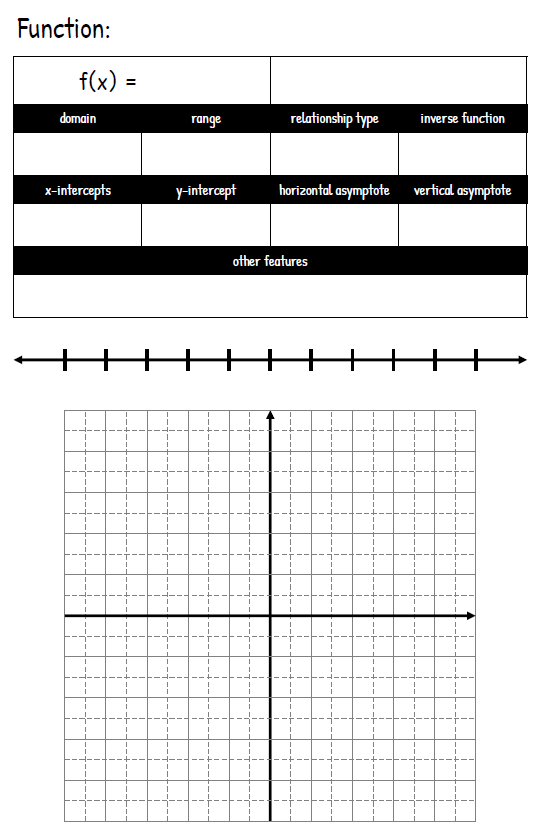
Importantly, I had the students figure out details as a class. After stating the rule for the function, we always filled in the two-sided number line, with inputs on the top and outputs on the bottom. I chose to use a number line instead of a table, as it allows me to point out the continuous nature of the values between each mark on the line.
Then we filled in the domain and range, examining the inputs and outputs to determine these. We also determined if the function is one-to-one or many-to-one. I’m really proud of how my students have become increasingly confident in determining these answers for themselves from their own understanding of the functions and their values.
Next, we plotted the function on the grid. The number line is deliberately aligned with this grid to help students make the connection between the two. I have a SmartBoard template set up with points along the x-axis, with which we move points up or down to plot the function, to emphasize how the graph demonstrates the connection between input and output values. Then knowing the shape of the graph allowed us to easily fill in the rest of the table.
The inverse function section depended on which function we were talking. Sometimes we filled it in immediately, as most students understood x² and √x as inverses. Other times we waited to fill it in, such as with exponential functions which was completed before we talked about logarithms.
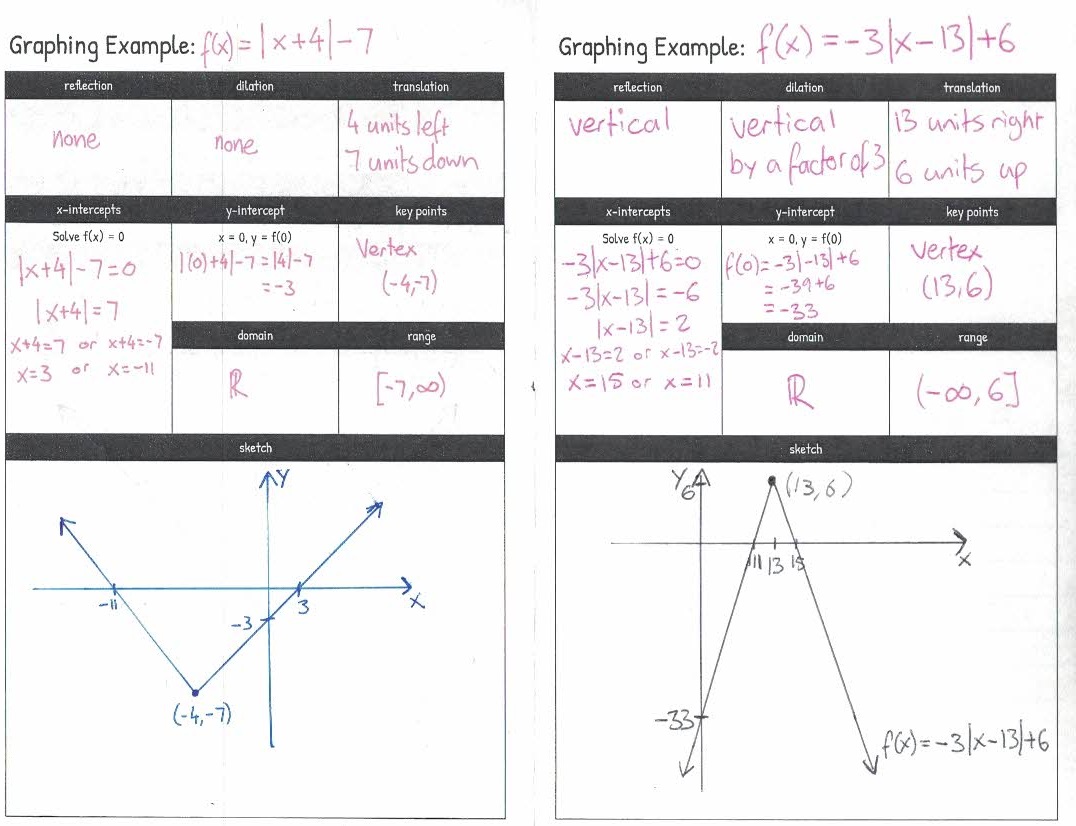
The second part of this template are the two “Graphing Example” section inside.
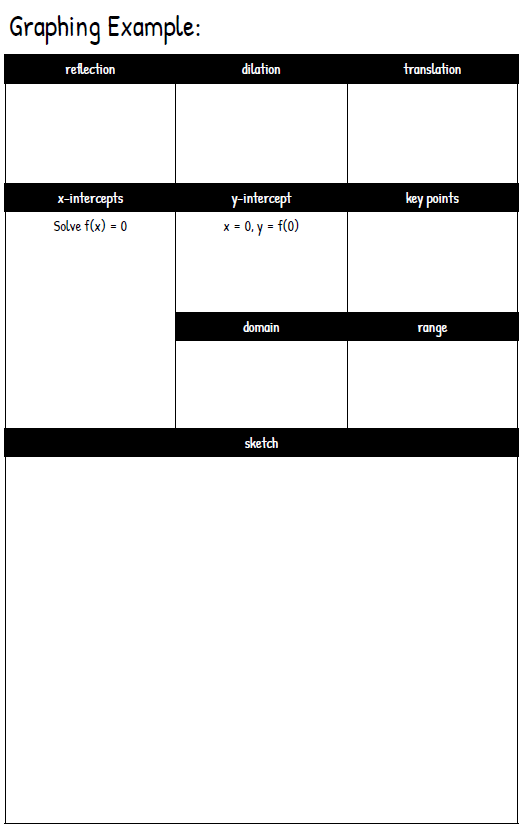
In the past, I’ve found students resistant to showing all the algebra they needed when they sketch a graph (usually because all they wanted to do was copy what their calculator showed.) I wouldn’t say this template has completely changed that, but it has made a big difference. Students complained a bit at the start of the year, but they’ve learned to appreciate the guidance this provides and gained a lot of confidence in their graphing ability. I know students probably don’t need to find the transformations of the parent function for every graph they sketch, but I think having them do this for each question we practice has helped their understanding of why each function produces the graph it does, and has helped serve as a check for the other parts of the template.
We’ve often had to leave the x-intercept section blank, because we’ve started graphing each type of function before we looked at solving equations involving that function. This has actually worked out pretty well. I found students accept my explanation that “We can’t do this yet because I haven’t taught you how.” Then, when we come solving those equations (typically the very next skill), I can use the need to find x-intercepts as a motivation for practicing solving equations. Then we go back to our graphing examples, find the x-intercepts, and add that detail to the graph. My students are sometimes annoyed that we jump backwards in our notes sometimes, but I think they appreciate that I’ve tried to avoid overwhelming them with too many details they don’t need to see all at once.
That’s been my approach all of this year: the idea that students don’t need to see all the detail until they’re ready for it. For instance, while we’ve talked about quadratic functions, we’ve only dealt with the vertex form, as that’s the form that can be explained through transformations, fitting the function pattern we’ve been following. Yes, we still need to talk about factoring, distributing and all that fun stuff. But now I feel we have a structure to build everything else on. I’m actually looking forward to completing the square this year, as I have a really useful motivation for it: it allows us to put quadratic functions into the form my students are already very familiar with.
We’ve introduced our last parent function now, so I’m not going to get any more use out this template this year. To be honest, I felt a little sad when we finished our last one, because it’s worked so well this year. Also, it means I’ll actually have to produce notes for each lesson now, instead of using the same ones over and over again…
You can find PDF and Publisher files here.
Included is a second version that leaves out the parent function template for a third graphing example.
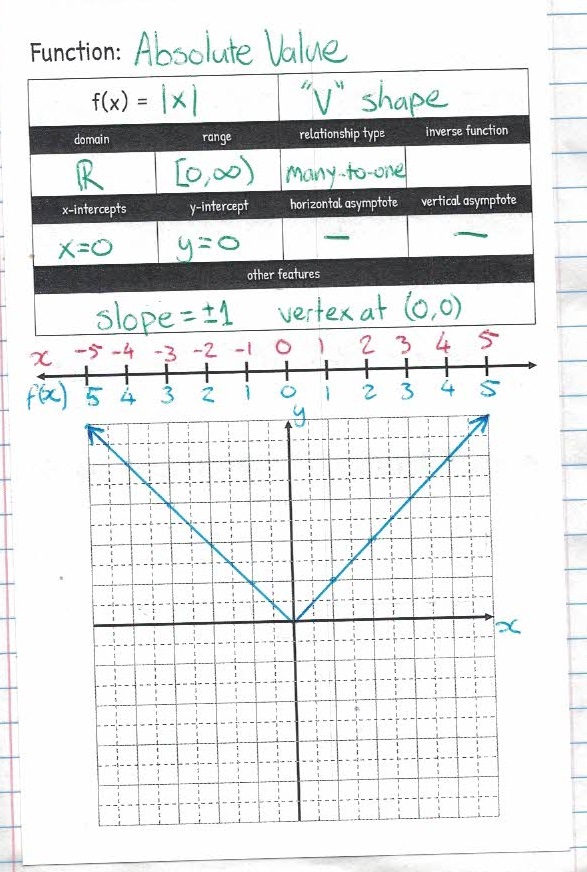
Below you can find all the parent functions from my notebook for this year, as well as a couple of the graphing examples pages.
Linear Function
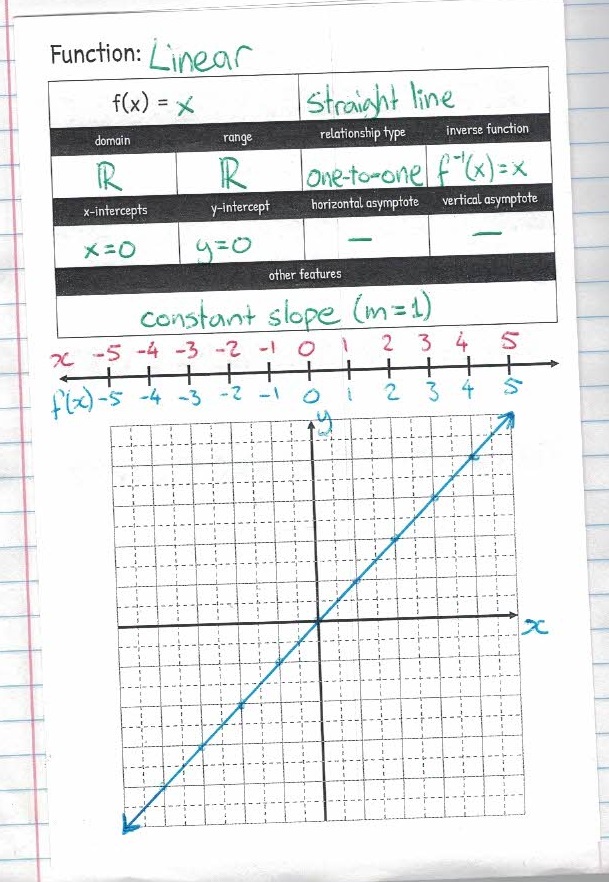
Absolute Value Function
Quadratic Function
Square Root Function
Cubic Function
Cube Root Function
Rational Functions
Exponential Function
Logarithmic Function
Graphing Examples
